Over the past decade, solar power has evolved from a promising technology to a mainstream solution in the global energy transition. With governments, industries, and communities investing heavily in solar infrastructure, installed solar capacity has grown rapidly worldwide.
How Much Energy Do Solar Panels Produce Worldwide? With global capacity surpassing 2,000 GW in 2024 and daily production reaching 2,075 GWh, solar energy is playing a crucial role in achieving climate goals. It provides affordable, sustainable, and reliable electricity, ensuring a greener and more resilient future for all.
Sources: SEIA, Ember Climate
This article delves into the remarkable rise of solar energy from 2013 to 2024, offering insights into the key drivers behind the growth, regional trends, and the impact on daily energy production.
Table of Contents
The Global Solar Surge: Installed Capacity Growth
From 2013 to 2024, the world witnessed a meteoric rise in installed solar capacity. In 2013, total global solar capacity stood at approximately 141 GW. By 2023, this number had increased tenfold to 1,419 GW, and in the end of 2023, with the addition of 655 GW in 2024, the total soared to 2,074 GW.
This rapid expansion reflects a combination of falling costs, government policies supporting renewable energy, and the pressing need to address climate change by transitioning from fossil fuels.
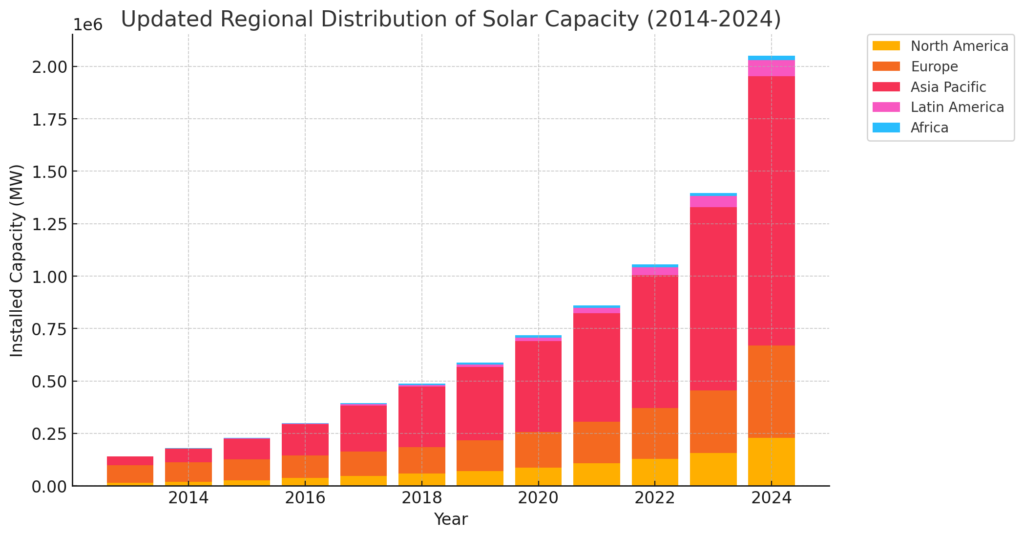
The chart below summarizes the growth in installed capacity across different regions over the past decade:

- North America: Grew from 14.6 GW in 2013 to 227.9 GW in 2024, with the U.S. contributing the most.
- Europe: Expanded from 84.2 GW in 2013 to 437.7 GW by 2024, led by Germany and Spain.
- Asia-Pacific: Dominates global growth, increasing from 406.9 GW to 1,279.6 GW by 2024, thanks largely to China.
- Latin America: Rose from 457 MW to 78.6 GW, with Brazil playing a key role.
- Africa: Achieved 20.3 GW by 2024, showing growing potential but with some challenges.
In 2024, the 655 GW added capacity was distributed proportionally across regions, based on their 2023 shares, with Asia-Pacific receiving the largest share. This year marked another milestone, pushing the total global solar capacity to 2,074 GW.
Understanding Daily Solar Energy Production
The amount of energy generated daily from solar installations is crucial in evaluating its impact on global electricity grids. Daily production depends not only on installed capacity but also on the capacity factor—the percentage of time that solar panels generate electricity relative to their maximum capacity.
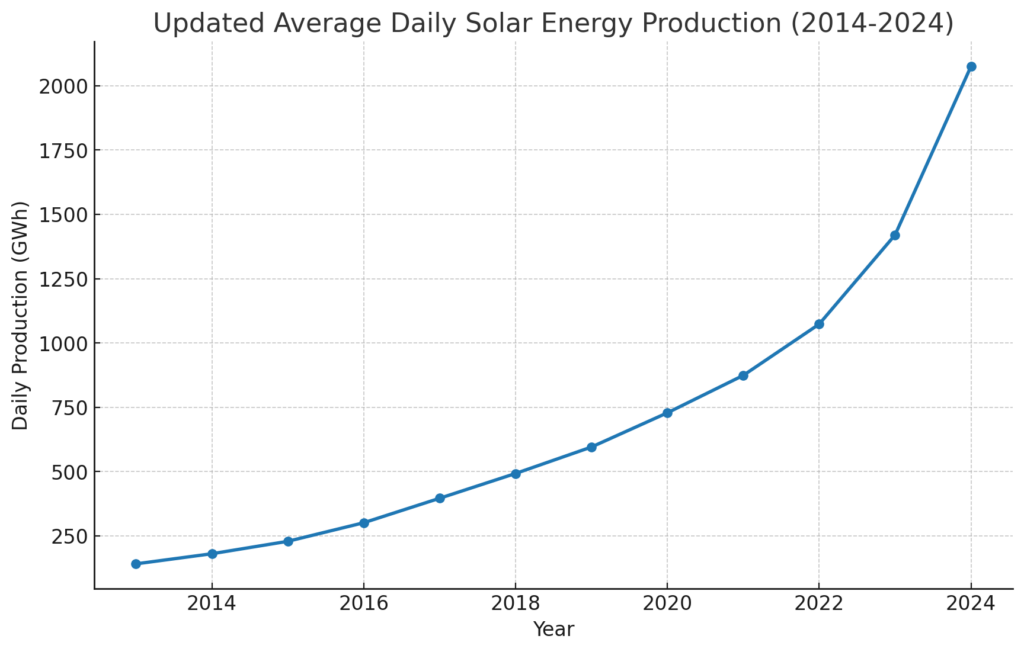
Since solar power is only generated during daylight, we assume an average of 5 hours of peak sunlight per day and a 20% capacity factor to calculate daily production.
Daily Production Trends and Estimates
Using the updated installed capacities, the following chart shows the average daily solar energy production over the years. With the new capacity in 2024, the world is now producing approximately 2,075 GWh per day from solar energy.

Regional Dynamics in Solar Energy Growth
Asia-Pacific: A Global Leader
The Asia-Pacific region remains the global leader in solar energy, receiving the largest share of new installations. By 2024, Asia-Pacific reached over 1,528 GW of installed capacity, cementing its dominance.
Europe: Steady Expansion Driven by Policy
Europe maintained its growth momentum, reaching 437 GW in 2024. Germany and Spain continue to lead the charge with strong policy support, including feed-in tariffs and incentives for rooftop solar installations.
North America: Consistent Growth in the U.S.
North America, with the U.S. leading the region, maintained its upward trajectory, reaching 227GW of installed capacity by end 2024.
Latin America: Emerging Solar Markets
Brazil continues to dominate Latin America’s solar expansion, contributing to the region’s total capacity of 78.6 GW by 2024.
Africa: Unlocking Untapped Potential
Despite challenges, Africa reached 20.3 GW in 2024, with countries like South Africa and Morocco leading new solar projects aimed at improving energy access.
Solar Energy’s Role in the Energy Transition
With the rapid increase in capacity and daily production, solar power is now a central component of the global energy mix. The 2,075 GWh of daily production in 2024 underscores solar’s growing role in reducing reliance on fossil fuels and decarbonizing electricity grids.
Key trends shaping the future of solar energy include:
- Continuous Capacity Expansion: Global solar installations are expected to grow by around 600 GW+ annually in the coming years.
- Energy Storage Integration: Battery systems will enable solar energy to be used even when the sun is not shining.
- Decentralized Solar Systems: Rooftop solar and microgrids will empower consumers and improve energy resilience.
- Emerging Markets: As costs fall, countries in Africa, Latin America, and Southeast Asia are expected to unlock new opportunities for solar growth.
Conclusion: Solar’s Future
The future of solar power looks brighter than ever. Solar energy is crucial in achieving climate goals, with global capacity surpassing 2,000 GW in 2024 and daily production reaching 2,075 GWh. It provides affordable, sustainable, and reliable electricity, ensuring a greener and more resilient future for all.
Governments, industries, and communities are now better positioned to meet the ambitious target of having 25% of global electricity generated from solar power by 2030. With ongoing technological advancements and supportive policies, solar energy will continue to lead the clean energy revolution.


